
HDFC Bank gets new CEO: Stock down 25% thus far in 2026; what charts say?
HDFC Bank Share Falling, Why: Technical analysts flag that the HDFC Bank stock rebounded after forming a base around ₹680 in September. Jatin Gedia and Drumil Vithlani expect support for the stock in the ₹710-680 zone.
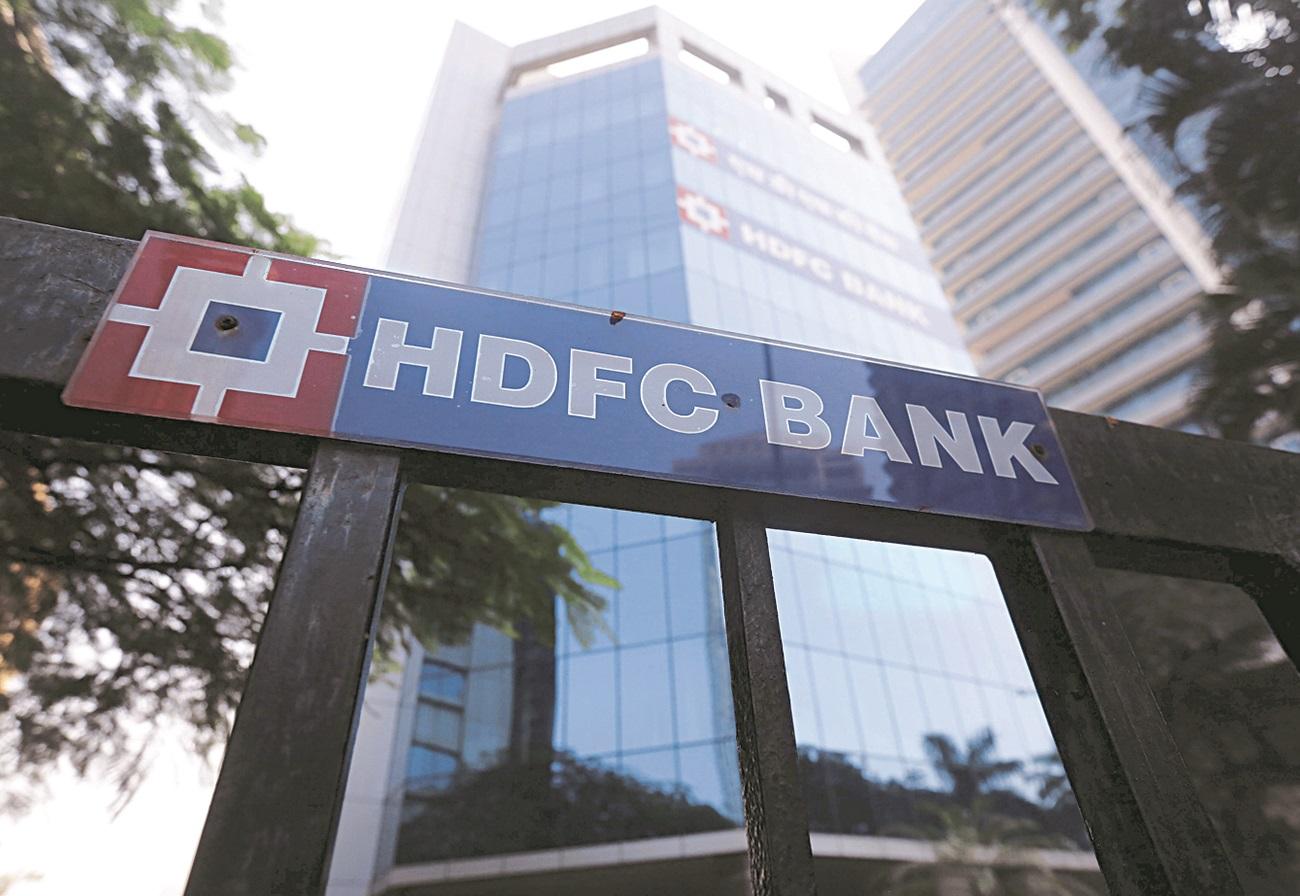
Disclaimer: Views and outlook shared on the stock belong to the respective analyst/ brokerages and are not endorsed by Business Standard. Readers' discretion is advised. HDFC Bank share price outlook: HDFC Bank stock jumped 1.8 per cent to an intraday high of ₹734 in Monday's trading session following the banking regulator's nod for Anup Bagchi's appointment.
Last week, the Reserve Bank of India approved the appointment of Anup Bagchi as the new managing director (MD) and chief executive officer (CEO) of HDFC Bank. Bagchi will take over from October 27, 2026, a day after Shashidhar Jagdishan's term ends. Brokerages believe Bagchi's appointment removes a key overhang on the leadership succession plan at HDFC Bank.
Analysts reckon that the focus will now be on the bank's growth strategy and what it does to bolster governance and restore investor confidence. ALSO READ | HDFC Bank: Anup Bagchi at helm lifts overhang; brokerages share outlook HDFC Bank stock witnessed a dismal run on the stock exchanges thus far in 2026. At current levels, the stock trades with a 25 per cent loss on a year-till-date (YTD) basis.
In comparison, the BSE Sensex has shed 14.8 per cent and the NSE Nifty 13.5 per cent in the same period. As of 10:30 AM on Monday, HDFC Bank stock had erased gains, and slipped into the negative zone. The stock traded with a loss of 0.5 per cent at ₹716.
Meanwhile, the Sensex and the Nifty were up 0.5 per cent and 0.4 per cent, respectively. Given this background, here's a chart check on HDFC Bank stock by technical analyst at Teji Mandi and Tiny Epic. Tecnical view on HDFC Bank stock Jatin Gedia, VP, technical research at Teji Mandi says that HDFC Bank stock has been forming lower-highs and lower-lows on the daily charts, suggesting a downtrend.
The analyst further flags that the stock formed a Hammer candlestick pattern on the weekly charts indicating buying interest in the ₹690-680 zone in the second week of September. Echoing a similar view, Drumil Vithlani, senior technical research analyst at Tiny Epic notes that HDFC Bank stock rebounded off the ₹680 base and is now holding above the short-term moving average, which is a near-term positive sign. Vithlani expects the bias to remain cautiously positive as long as the stock holds above ₹700, below which next support is visible at ₹680.
On the upside, the analyst sees immediate resistance in the ₹735-745 band followed by ₹760. Gedia highlights that currently HDFC Bank stock is trading around ₹715-710 levels, which coincides with the 61.8 per cent Fibonacci retracement level of the ₹684-750 rally. He adds that the stock recently resumed its decline after rallying toward ₹750.
ALSO READ: Stock Market LIVE: Sensex off 500 points from day's high The analyst from Teji Mandi believes that a move beyond ₹750 would violate the lower-high lower-low structure and suggest a trend reversal from down to up. Gedia sees ₹710-696 as the crucial support zone for the stock, and ₹740-750 as the immediate hurdle zone.
Related Stories

Gold prices near Rs 1.47 lakh/10 grams, silver falls by Rs 1,144/kg as traders await Fed rate signals. What lies ahead?
Gold prices edged lower while silver fell on MCX as investors awaited the US Federal Reserves upcoming policy decision for clues on interest rates. Traders expect rates to remain unchanged in October, with a possible hike in December. Analysts say dollar strength may cap golds upside, while central bank buying supports longer-term prices.

Infosys, TCS, Coforge, HCL Tech, TechM, Sagility: Selective rerating ahead, Jefferes shares target prices -
Infosys and TCS are seen as large IT companies offering 20 per cent-plus rerating potential in the best case. Sagility stands out among mid-sized companies, Jefferies said.

YES Bank share price targets: Goldman Sachs, Citi among 10 brokers with 'Sell' calls; what Nomura, others say -
Goldman Sachs has a target price of Rs 17 for YES Bank, while Citi sees the stock falling to Rs 16.50. Kotak Institutional Equities and Nuvama Institutional Equities have even lower targets of Rs 16.